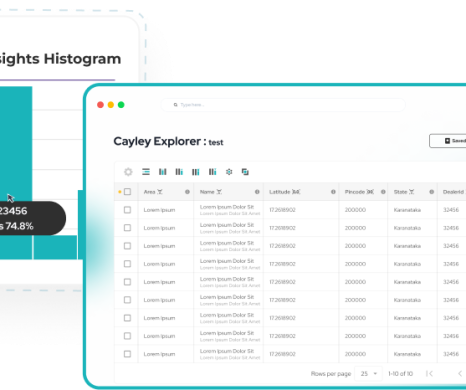
Data Visualization that empowers both beginners and experts to explore data, understand data and craft compelling data stories effortlessly. Its seamless integration with Emly Labs data preparation and AI modelling turbocharges the business intelligence
Simple interface boosts productivity and accessibility for users of all levels. It simplifies data exploration and analysis, enabling swift insights without extensive training. This inclusivity fosters collaboration, accelerates decision-making, and enhances user satisfaction, making data-driven success attainable for all.
Comprehensive Visualization Library
Explore a rich library of advanced visualization options that go beyond basic charts. Create scatter plots, box plots, network graphs, geographical maps, and other complex visualizations to gain deeper insights from your data.
Interactive Dashboards
Build interactive dashboards that allow users to explore data dynamically. Incorporate drill-down capabilities, filters, and interactive elements to facilitate in-depth data exploration and business intelligence.
High Scalability
Emly Vizard is designed to handle large volumes of data. It leverages dynamic infrastructure and intelligent caching to ensure robust performance as your business grows.
Empowered by the Emly Ecosystem
It seamlessly integrates with data preparation tools, and advanced AI modelling capabilities, and more. This combination makes your business intelligence process complete, robust and effective.
Simplifies complex data sets, making them easier to understand and interpret, even for non-technical audiences. Making your Business intelligence accessible to all.
Enhanced Communication
Data Visualization are the effective way to communicate data-driven insights to stakeholders, fostering better understanding and alignment.
Better Engagement for Data-Driven Culture
Data visualizations play a crucial role by making data accessible, engaging, and easy to understand, aligning teams around common data-driven goals.
EMLY DataLab accelerates data preparation and enrichment effortlessly through its no-code approach, ensuring scalability for handling very large datasets.
External data is pivotal as it enhances insights, accuracy, and generalization in AI Models. It captures real-world behavior, and helps mitigate bias. It offers a competitive edge, enriching decision-making and insights.